vizland.github.io
VIZLAND
The visualization project VIZLAND (VisualIZation LANDscape) created by Marcus A. Gordon, allows for the exploration of 60+ common data visualization types, their descriptions, and examples of use. The project will manifest into a web prototype that will to act as a learning tool and satisfy the need to query visualization types, more specifically, their functions, interactively.
This repository documents the development and experimentation process behind the prototype. To be a learning tool in the OCAD University Visual Analytics Lab, it will experience further experimentation by graduate students and researchers in our quest for knowledge and analysis of data visualization methods.
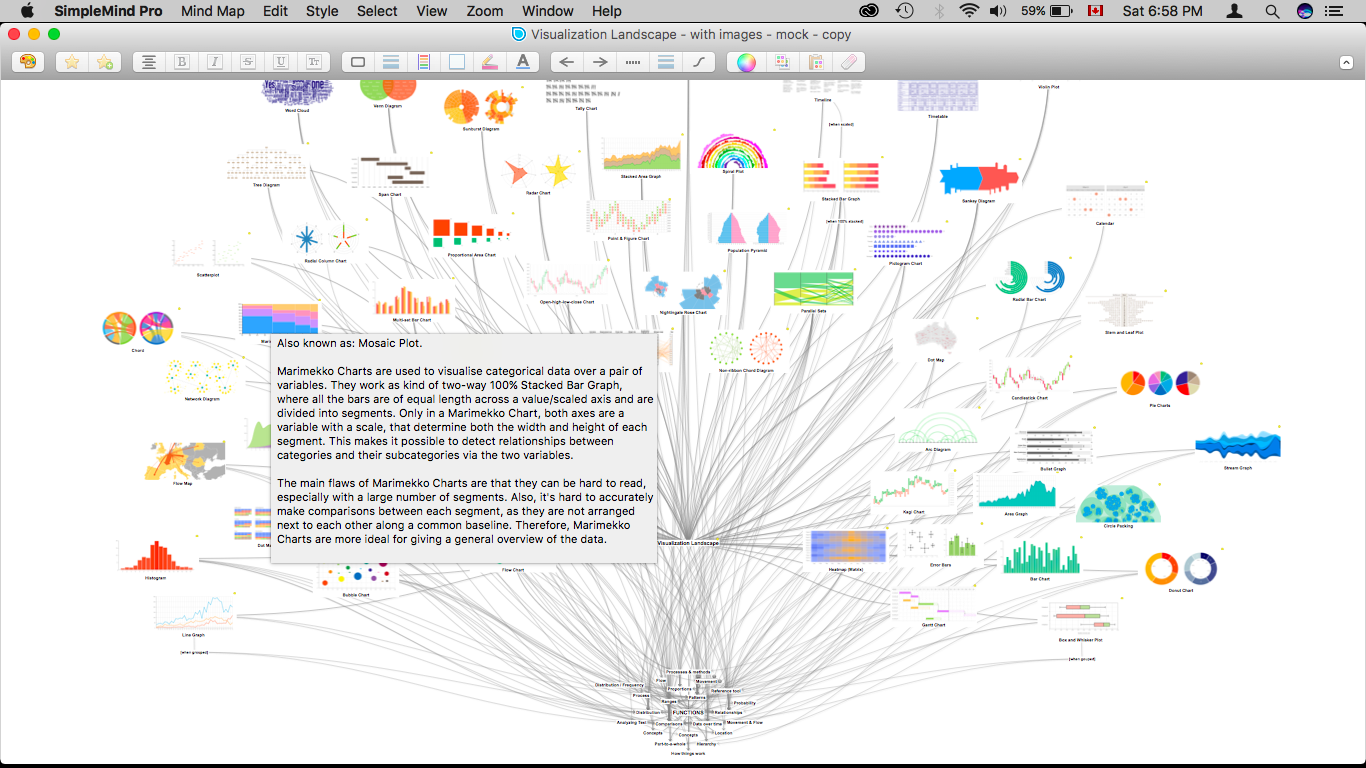
VIZLAND v.1: Mindmap to run string queries on the visualization types, including their titles and descriptions. The map is simply a rough makeup of the original information source from the Data Visualisation Catalogue by Severino Ribecca. About
Download v.1 Requires free SimpleMind download. (select “SimpleMind - Free Edition”)